Abstract
Television suppliers must register television appliances, which are to be sold in Australia and New Zealand, with the Australian government. The preferred attributes of the registered television appliances such as screen size, power consumption and technology (e.g. LCD, Plasma, OLED, etc.) plays an important role in deciding which combination of attributes are favorable for the Australian and New Zealand consumers. The purpose of this report is to investigate the relationship between the physical attribute of television appliances (screen size, power consumption and technology) and their associated energy ratings. The dataset used in the analyses, as obtained from the Australian government, contains all the television appliances registered between April 2013 to January 2018 for sale in Australia and New Zealand. This dataset was processed, interpreted, analyzed and visualized utilizing the R analytical programming language. This report sheds light on the preferred combination of attributes (screen size, technology, power consumption and energy rating index) of the television appliances that are registered by the suppliers. The report also highlights an interesting relationship between power consumption and energy rating index. This report may influence the way consumers decide to choose between television appliances based on information and insight that are contained in the report.
Keywords: Analysis, R, Energy Rating Index, Screen size, Power consumption, Brand, Television Appliance
Introduction
According to ACMA [1], twenty nine percent of households had purchased a new television set in the 12 months before the ACMA media release 46/2012 - 20 June study, and 70 per cent had bought a new set in the three years prior to the study. With the advent of new television technologies such as LCD, Plasma, OLED and LCD (LED), increased screen sizes and various smart TV capabilities, it has become difficult for the average consumer to understand where the cost benefits are for the new television appliances. There seem to be a general misconception amongst consumers as to how different television appliances that consists of different attributes relates to price and energy ratings. Consumers seems to think that there is a linear correlation between television appliances power consumption and their associated energy index ratings. It is this latter aspect that has motivated me to find out what the true relationship is between the various attributes of television appliances, especially the relationship between power consumption, screen size, technology and energy ratings.
Data
All suppliers are obligated by law to register household appliances, which are to be sold in Australia and New Zealand, with the Australian government. The data for these registered household appliances is made available by the Australian Government [2]. These datasets are regularly updated by the Australian Government but, for this report a specific registered, television appliances dataset was downloaded from the URL as specified in [3]. The datafile is in csv (comma-separated-variable) file format. The dataset contains 3381 entries of registered television appliances. A total number of 31 variables are captured per record of which 19 are of type Factor (17 – Categoric Nominal, 2 - Date), 12 of type Numerical (11 – Numeric,1 - Integer). There was no prior intervention on the dataset and the dataset was utilized and consumed as downloaded.
Methods
The R-Studio software application (Version: 1.1.383) was used to download and process the television appliance dataset. Functions from the cluster, tidyverse and dplyr libraries were utilized to explore, analyze, evaluate, filter, tidy, transform, summarize and visualize the dataset. Of the 31 available variables only 6 variables, as listed in [A1] (4 of type Numerical and 2 of type Categoric - Nominal), were deemed necessary for the analysis process. The rest of the variables were discarded. The screen size variable was converted from centimeters (as measured diagonally) to inches - this falls more in line with consumer understanding of television screen sizes. The technology variable has 4 possible values: Plasma, LCD, LCD (LED) and OLED. These values are treated as nominal. The SRI (Star Rating Index) variable was rescaled to a value in the range [1:6], which corresponds to the consumer industry star rating standard. Unnecessarily long brand names were shortened to be better displayed in ggplot2 visualizations. All records containing empty values were discarded. The numeric variables Active Power and Standby Power were rounded to two decimal points. A total of 3115 records remained after the original dataset was filtered and missing value records were imputed. See A – R Code for associated R code listings.
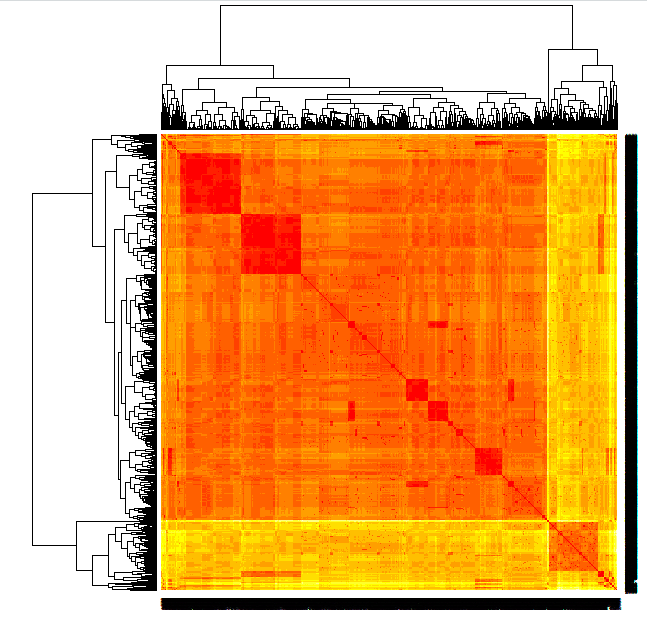
A summary of the dataset is listed in [A2]. A Gower’s dissimilarity matrix was created and then a heatmap was generated from that. The generated heatmap [A3] revealed some interesting clusters, which probably points to the demarcation boundaries between certain technology types of the registered televisions.
Group based data summarization are listed in [A4] and [A5]. The select function in base R as well as the groupby and arrange functions from the dplyr library were used to filter, group and arrange the dataset in these summarizations. Lastly, ggplot was used to create visual presentations (scatter plots, box plot and line plots) of the following variables: Screen size vs. Active Power, Screen size vs. Energy Rating Index and Technology vs. Energy Rating Index. The scatterplots were overlaid with line plots, which were derived as linear regression models. The lm function in base R was utilized for the regression models.
Results and Discussion
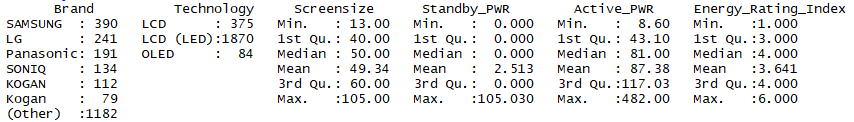
A summary of the dataset [A2] reveals that LG, Samsung and Panasonic are the three suppliers who registered the greatest number of television appliances, i.e. a total of 1161. Of the four registered technologies, the LCD (LED) technology was by far the leading technology for registered television appliances with a total of 2656. The average screen size was 46.2 inches, the average active power consumption was 75.96 Watts and the average energy rating was 3.72.
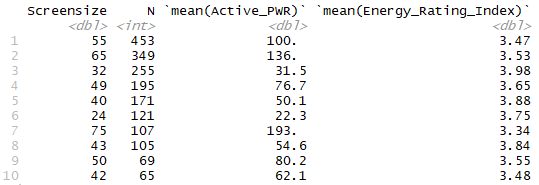
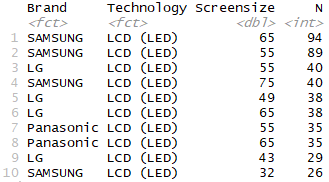
The heatmaps for the dataset [A3] illustrates some interesting clusters and probably coincide with the different technologies and screen sizes. The group-based summarization in [A4] indicates that the 55-inch screen size was the top screen size registered with a total of 539. Interestingly, the 65-inch screen size was the third most registered screen size after the 32-inch. Due to the popularity of the 65-inch screen size one would think that the 60-inch screen size should be equally sought after but, the 60-inch screen size appliances ranks only 8th with a total of 109 appliances registered. The group-based summarization in [A5] indicates that the LCD (LED) is overwhelmingly popular as a technology with Samsung and LG dominating the registration list with their 55-inch, 32-inch and 65-inch LCD (LED) appliances.
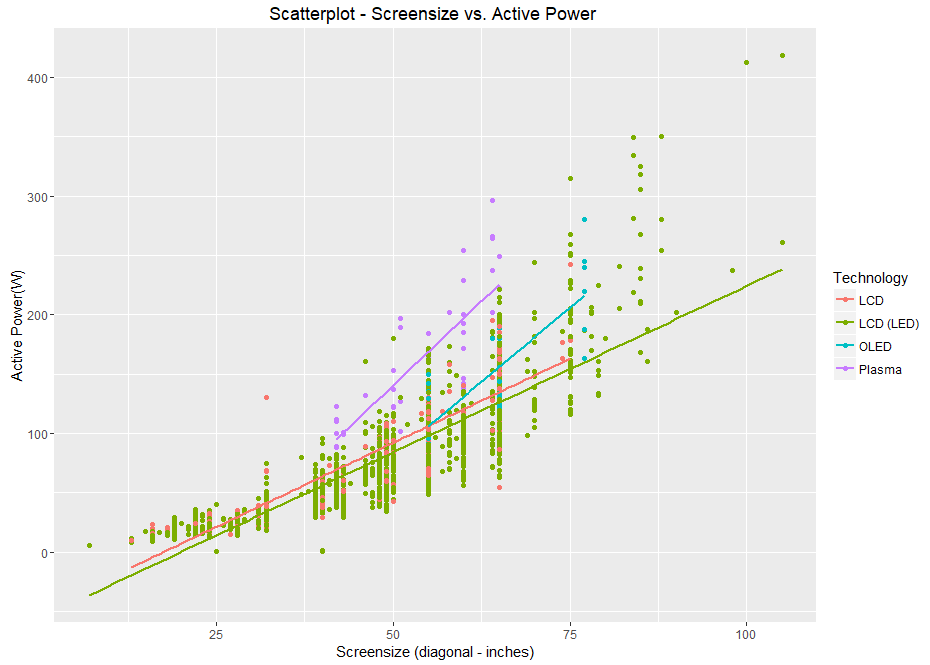
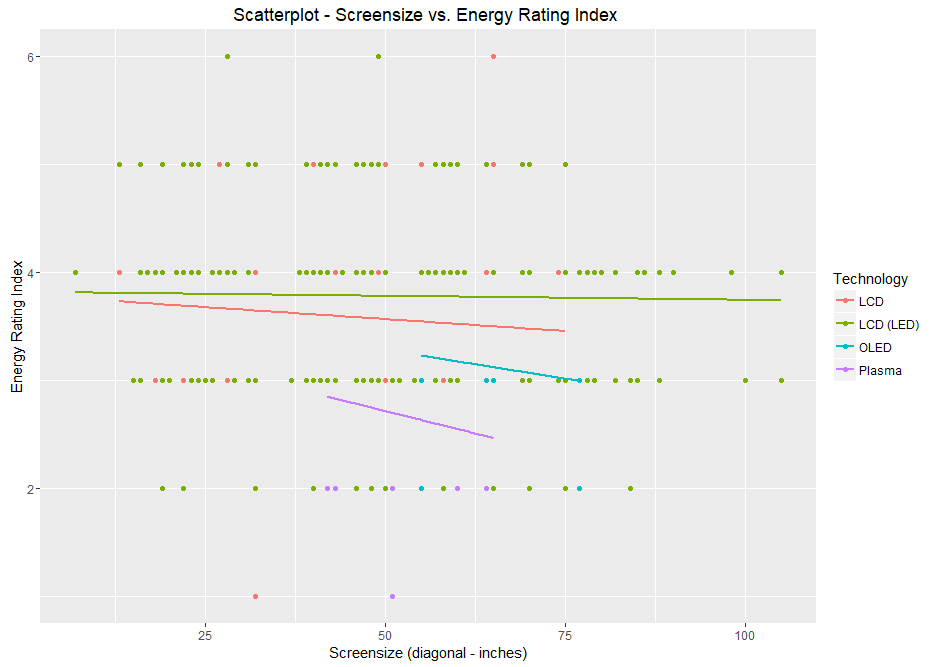
The scatterplot in [A6] illustrates the direct linear relationship between screen size and active power consumption. This is to be expected, as more pixels obviously requires more power. This trend holds true for all 4 technologies. The scatterplot in [A7] suggest a very weak linear inverse relationship between screen size and energy rating index. One would expect that energy efficiency drops linearly for increasing screen sizes because, more pixels consumes more energy. However, the scatterplots in [A6] and [A7] suggests otherwise. The scatterplot in [A7] also indicates that there are a wide range of screen sizes registered for each energy rating index.
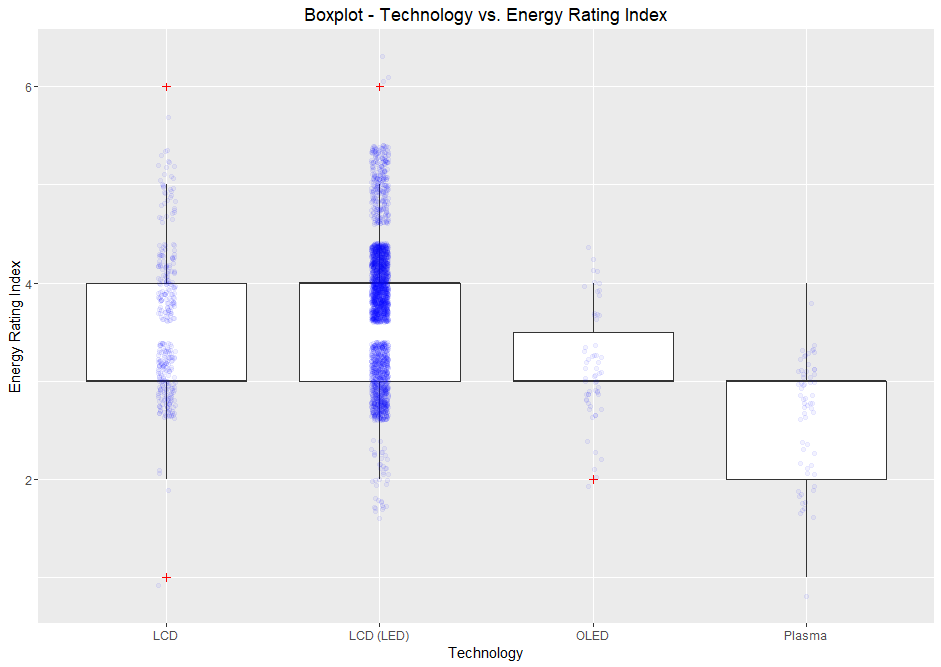
Lastly, the boxplot in [A8] illustrates the different technologies vs. energy rating index. From the plot one can deduce that both LCD and LCD (LED) technologies have, on average, a higher energy rating index and therefore are more energy efficient technologies.
Conclusion
The disparity that is illustrated between the scatterplots in [A6] and [A7] correlates well with the advice given by Australian government’s Energy Rating website, under the section The Energy Rating Label on Television [4]. This means that the energy rating star system is meant to be used to compare television appliances of the same screen size. E.g. when a consumer chooses between two 55-inch screens, which both have the same attributes but, the one has an energy star rating of 5 and the other has an energy star rating of 3. Then, the consumer should choose the one with the energy star rating of 5, as this one would be the more energy efficient 55-inch appliance. This is how the energy star rating system is meant to work. Therefore, the opposite then holds true – a consumer cannot use the energy star rating index to compare a 32-inch LCD screen with an energy star rating index of 3 stars, with a 65-inch LCD television with an energy star rating index of 5 stars. By design, there is no possible way for a 65-inch LCD screen to consume less power than a 32-inch LCD screen. Furthermore, from the results it is obvious that suppliers are registering an overwhelmingly higher number LCD (LED) technology driven television appliances with screen sizes of 55-inches. To the consumer, this should be a clear indication that the greatest price competition point will be on this joint front. Therefore, the average consumer will most likely find the best value for money by looking at 55-inch LCD (LED) television appliances. Then, lastly, the consumer can compare the energy ratings the 55-inch LCD (LED) appliances to find the one which is most power efficient. Both those criteria could enable the consumer to find good value for money in terms of technology, screen size and power consumption.
Appendix 1
Table - Selected variables from original dataset
| Variable | Type | Description |
|---|---|---|
| Brand_Reg | Categoric - Nominal | This is the manufacturers brand |
| screensize | Numerical | The diagonal measurement of the screen in cm |
| Screen_Tech | Categoric - Nominal | This is the type of screen technology (LCD, Plasma, OLED, etc…) |
| Act_stnd_power | Numerical | This is the time allocated that the television will be in active standby mode. |
| Avg_mode_power | Numerical | This is the amount of energy used by the appliance when the television is in use. |
| SRI | Numerical | The current Star Rating Index for the appliance. |
Appendix 2
summary(Data_2)
Table - Summary of cleansed dataset
Appendix 3
Dist \<- daisy(Data_2, metric = "gower")

Dist \<- as.matrix(Dist)

dim \<- ncol(Dist) \# used to define axis in image

heatmap(Dist, Rowv=TRUE, Colv="Rowv", symm = TRUE)
Figure – Generated Heatmap
Appendix 4
Data_2 %\>%

group_by(Screensize) %\>%

summarise(N = n(), mean(Active_PWR), mean(Energy_Rating_Index)) %\>%

arrange(desc(N)) %\>%

head(10)
Table – Top 10 screen sizes registered
Appendix 5
Data_2 %\>%

group_by(Brand, Technology, Screensize) %\>%

summarise(N = n()) %\>%

arrange(desc(N)) %\>%

head(10)
Table – Top 10 brands registered technologies by screen size
Appendix 6
ggplot(data = Data_2) + geom_point(mapping = aes(x = Screensize, y = Active_PWR,
color = Technology)) + geom_smooth(mapping = aes(x = Screensize, y = Active_PWR,
color = Technology), method = "lm", se = FALSE) + xlab("Screensize (diagonal -
inches)") +

ylab("Active Power(W)") + ggtitle("Scatterplot - Screensize vs. Active Power ")
Figure – Screen size (inches) vs. Active Power (W)
Appendix 7
ggplot(data = Data_2) + geom_point(mapping = aes(x = Screensize, y =
Energy_Rating_Index, color = Technology)) + geom_smooth(mapping = aes(x =
Screensize, y = Energy_Rating_Index, color = Technology), method = "lm", se =
FALSE) + xlab("Screensize (diagonal - inches)") +

ylab("Energy Rating Index") + ggtitle("Scatterplot - Screensize vs. Energy
Rating Index ")
Figure – Screen size (inches) vs. Energy Rating Index (1:6)
Appendix 8
ggplot(data = Data_2, mapping = aes(x = Technology, y = Energy_Rating_Index)) +

geom_boxplot(outlier.color = "red", outlier.shape = 3) + geom_jitter(width =
0.1, alpha = 0.05, color = "blue") + xlab("Technology") + ylab("Energy Rating
Index") +

ggtitle("Boxplot - Technology vs. Energy Rating Index")
References
-
ACMA. 2018. Bigger, better, cheaper: Australian households embrace digital TVs. [ONLINE] Available at: https://www.acma.gov.au/theACMA/acma-media-release-462012-20-june-bigger-better-cheaper-australian-households-embrace-digital-tvs. [Accessed 15 February 2018].
-
Data.gov.au. 2018. Energy Rating Data for household appliances – Labelled Products. [ONLINE] Available at: https://data.gov.au/dataset/energy-rating-for-household-appliances. [Accessed 15 February 2018].
-
Data.gov.au. 2018. NA. [ONLINE] Available at: https://data.gov.au/dataset/559708e5-480e-4f94-8429-c49571e82761/resource/93a615e5-935e-4713-a4b0-379e3f6dedc9/download/tmpvhqhjztv20180202.csv. [Accessed 15 February 2018].
-
Energy Rating. 2018. http://www.energyrating.gov.au/products/televisions. [ONLINE] Available at: http://www.energyrating.gov.au/products/televisions. [Accessed 15 February 2018].